A Name Is Rising: Check Whether the Claim Means Rank, Count or Share
Rising can describe several different measurements. Before a trend influences your shortlist, identify the years, exact spelling and quantity being compared.
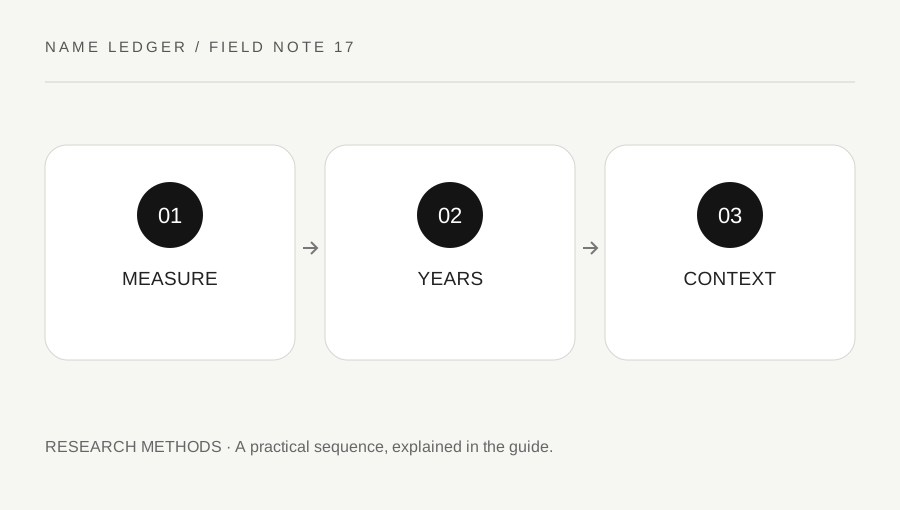
Original explanatory diagram. Numerical examples in this guide illustrate the reasoning; they are not a claim of hands-on testing.
Define the change being claimed
A name can move toward the top of a ranking, gain recorded uses or increase its share of a defined birth population. Those statements are related but not identical. A headline saying a name jumped many places may not tell you how many additional uses were recorded. Ask which measure the writer used before deciding what the change means.
Keep the exact spelling, source category and geography consistent. A comparison that groups variants in one year but not the other is not measuring the same thing. The explorer on this site contains only the published 2025 rows, so it does not calculate or display a trend. Use the official historical tools or files for a question that genuinely requires more than one year.
Read the starting point as well as the difference
A change from a small starting count can look dramatic as a percentage while still involving few recorded uses. Likewise, a large positional movement far down a list may occur among rows with close counts. Read the original and final values rather than only the change. Missing or suppressed data must not be silently treated as zero.
If you compare shares, use a denominator that matches the source and question, and label it clearly. Do not substitute the sum of a selected top list for all births while describing the result as a national birth share. For many family decisions, you may not need a calculated rate at all. A consistent year-by-year count record can answer a narrower question more transparently.
Work through hypothetical changes
Imagine a name moves from 20 recorded uses to 40. That is twenty additional uses and a doubling of the starting count. Another hypothetical name moves from 2,000 to 2,200, adding two hundred uses with a smaller percentage increase. Neither example automatically tells you which candidate will feel more familiar in a particular community. These are arithmetic illustrations, not source rows.
Now imagine two positions moving closer to the top while the relevant populations also change. Position alone does not reveal whether each count or share increased. Read the actual historical values before calling the trend a surge. This habit prevents an attention-grabbing change statistic from replacing the more ordinary question of how the candidate fits the family’s preferences.
Keep forecasts separate from history
An observed increase does not guarantee another increase next year. A family can notice a pattern without treating it as a prediction. Avoid claims that a name is about to become unavoidable unless there is a clear model, relevant evidence and honest uncertainty. Even a sophisticated forecast would not predict every local classroom or social circle.
Record a trend finding with the measured years, values and source link. If the claim remains vague, label it unverified and do not let it dominate the shortlist. You can still like a candidate regardless of whether recorded use rises or falls. Historical context is most useful when it supports a clear discussion, not when it creates pressure to select or reject a name before an imagined future wave.
Check whether the writer switched measures mid-story
Read the headline, chart axes and explanatory text together. A story may begin with rank movement, show counts in a chart and conclude with language about future prevalence. Each step needs its own support. If the measures change, rewrite the supported findings as separate sentences in your note. This makes the uncertainty visible without requiring you to dismiss the entire source. A careful reader can retain a useful historical observation while declining a forecast or a broader interpretation that the data does not establish.
A practical checklist
Tick items for your own use. This checklist is saved only in this browser.
Questions that come up
Can this one-year explorer show rising names?
No. It provides a published 2025 snapshot. Use consistent historical data from the official source to investigate change.
Is a doubling always a large absolute change?
No. The starting value matters. A small count can double while adding fewer uses than a modest percentage change in a large count.
Can a trend predict a classroom?
Not reliably from national history alone. Local context and chance remain relevant, and the explorer does not make that prediction.
References & scope
Background references checked on 18 October 2026. The examples and practice exercises are original editorial explanations, not copied procedures or professional advice.